Don’t waste time writing detailed prompts
Lazy Looping Method
ChatGPT isn’t just about text generation.
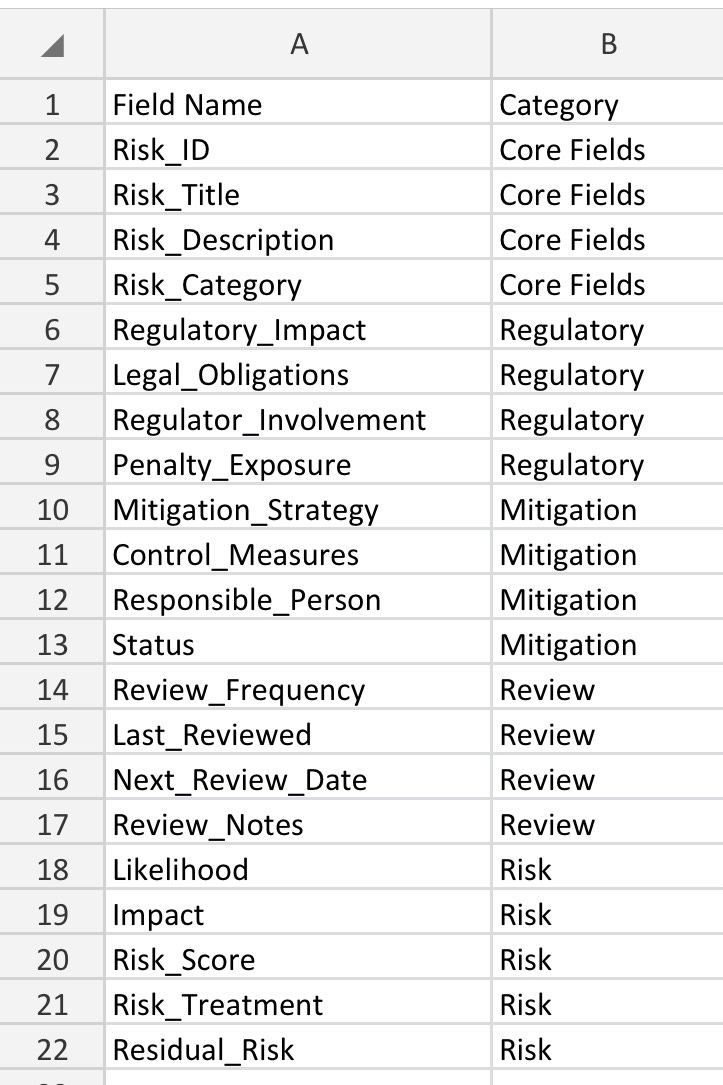
Here’s a trivial example: ask the LLM to generate a Risk Register data model for a FinTech Startup. Here’s the resulting CSV in mobile Excel:
Now, ask it to visualise that CSV…
The magic here is not that I got a pretty visual.
Rinse and Repeat
It demonstrates a simple prompt tactic I’m using more and more that you might find useful. I call it the Lazy Looping Method…
Rather than waste time writing detailed prompts to get the desired output, run through a task once with ChatGPT until you are happy with the output. Then, ask the model to generate a detailed prompt to produce the same output again.
Here’s the prompt it generated:
Generate a risk register data model for a fintech startup with a focus on regulatory compliance, security, operational, and financial risks. Include fields related to regulatory impact, legal obligations, regulator involvement, and penalty exposure. Provide both a detailed tabular model and a visual representation of the relationships between fields.
The graph visualization should include the following enhancements:
• Use a hierarchical layout (e.g., kamada_kawai_layout or similar).
• Group nodes into logical categories (Core, Regulatory, Mitigation, Review, and Risk).
• Use distinct colors to represent each category, with a clear legend for the colors.
• Adjust node spacing for clarity and readability.
• Highlight core fields like “Risk_ID” and “Penalty_Exposure” appropriately.
Render the graph using NetworkX and Matplotlib, ensuring it is clean, visually appealing, and easy to interpret.
Need something other than a risk register?
Don’t edit this prompt!
Just paste the prompt into ChatGPT and ask it to remix it based on your requirements.
Cheers, Craig
P.S Try it out and let me know how you get on.


